For companies that are building strategies to win in Africa’s growth spurt, prioritizing markets across the 54 countries is very important.
Prioritization is very important because it allows managers to choose the top markets that would bring in the highest ROI on their business development efforts.
Providing returns that companies can use to reinvest in the business development and fuel sustainable business expansion across the continent.
But how do managers prioritize markets across Africa’s vast and complex landscape? Choosing the top countries to focus on – among 54 unique countries can be very challenging.
AMPI – Africa Market Potential Index
To support investors, business development and sales managers in assessing which African country to prioritize in their organization’s expansion plan, we developed a tool -The “Africa Market Potential Index” (AMPI) – that provides a quick way for managers to asses market potential across the African continent.
A lot of the information to determine which African countries to expand into is housed in different fragmented places.
This can lead to a lot of time lost by businesses researching what markets hold the most potential for their organization.
That’s the reason why we consolidated these important market data point into an easy-to-use visualization.
Our Business in Africa market potential index (AMPI) determines the market attractiveness across 50 African countries by measuring seven key metrics in critical areas of each country – economy, social-political landscape, technological adoption, infrastructural developments, and the efficiency of doing business.
These seven pillars act as key determinants to both the short and long-term market potential of each country. The seven pillars (along with their weighting) are given in the table below.
Description
Weighting
This evaluates the size and appeal of the domestic market.
20%
Measures the stability of the macroeconomic environment.
20%
Measures the quality of governance.
10%
Measures social development of the country.
10%
Measures the efficiency of technology, logistics, and infrastructure as a supporting base for the business environment.
15%
Measures the degree of dependence of the economy on the sectors and resources in the country.
10%
Measures the ease of doing business in the country.
15%
The weighted average of the seven factors above to determine the market potential of each economy.
100%
Within each pillar, a set of key indicators have been included with specific weightings to arrive at the overall pillar rank and score. The weighted averages of these seven pillars provide a starting point for country-by-country comparisons about business in Africa.
Short-term Pillars
The first two pillars – market size & appeal and macroeconomic resilience – are short-term factors, and account for 40% of the total weighting.
Long-term Pillars
The other five pillars are long-term factors and this account for the remaining 60% of the total weighting.
2019 Rankings
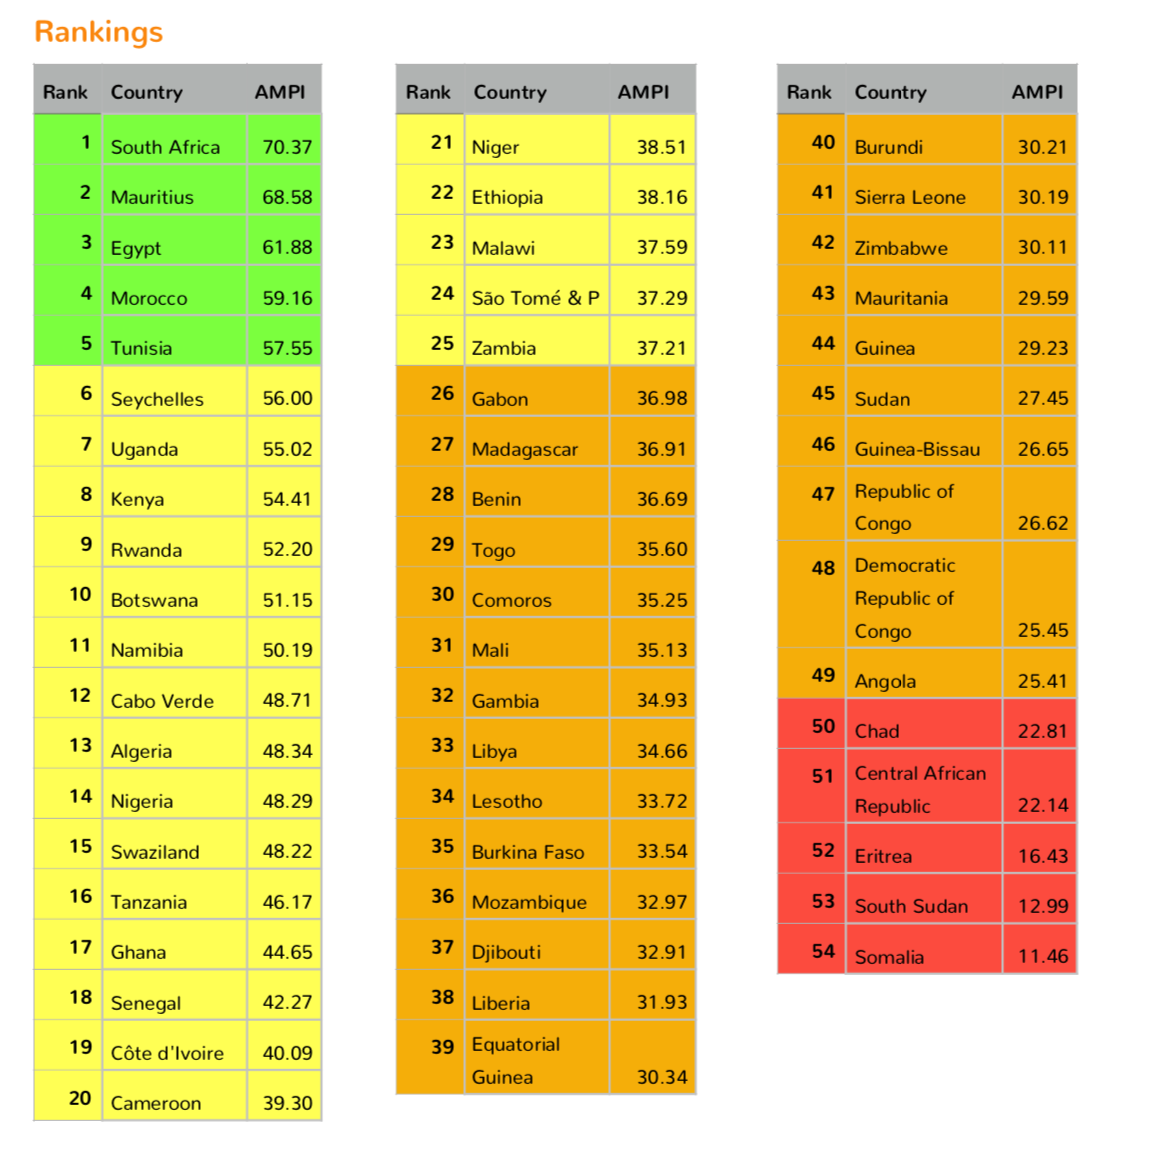
Here are the 2019 rankings of the market potential across 50 countries in Africa

Country Comparisons
With the AMPI framework, companies can do country comparisons along all seven pillars to figure out which countries to prioritize in their growth plans. Here are some country comparisons that we did:
Regional Analysis
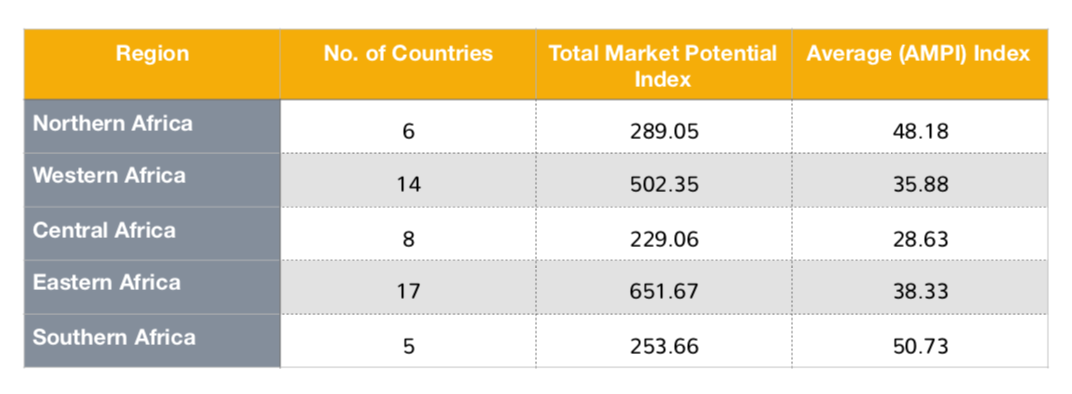
The table below outlines each region along with the number of countries, the total, and average market potential index of each region.
This breakdown helps to assess where the opportunities lie regionally.

Performing Your Own Analysis
Every organization invests its time and resources differently to meet different goals. The analysis provided above are based on weighted averages of seven market pillars that are pertinent to the robust measurement of the potential in each country.
The weighted averages chosen are a baseline for you and your organization to begin the conversation about where to focus your priorities in Africa over the next few years. Depending on the needs of your organizations, certain factors and pillars might weigh quite differently from the baseline presented above.
By applying different weighting to each pillar – higher weightings on pillars that are more relevant to hitting your business goals.
