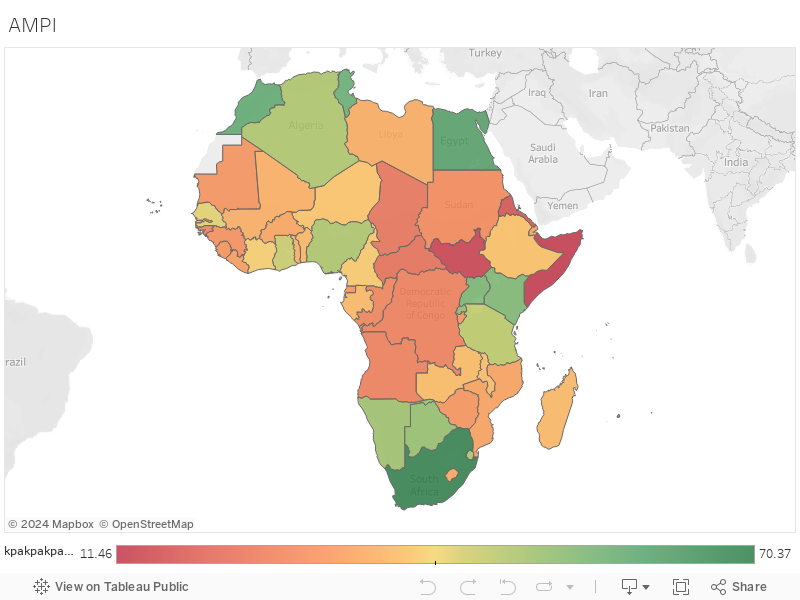
To support business development and sales managers in assessing which African country to prioritize in their organization’s expansion plan, we developed a tool (kpakpakpa’s Africa Market Potential Index- AMPI) that provides a quick way for managers asses market potential across the African continent.
Our Africa market potential index (AMPI) measures key metrics in critical areas of each country’s economy, social-political landscape, technological adoption, infrastructural developments, and the efficiency of doing business.
kpakpakpa’s AMPI measures the market attractiveness of 48 African countries, across seven pillars. These seven pillars act as key determinants to the short and long-term market potential of each country.
The seven pillars, and their respective weighting factor, that make our market potential Index
Factors
Description
Weighting
Market Size & Appeal
This evaluates the size and appeal of the domestic market.
20%
Macroeconomic Resilience
Measures the stability of the macroeconomic environment.
20%
Political Landscape & Governance
Measures the quality of governance.
10%
Social & Human Development
Measures social development of the country.
10%
Investment in Technology, Infrastructure & Logistics
Measures the efficiency of technology, logistics, and infrastructure as a supporting base for the business environment.
15%
Economic Diversification
Measures the degree of dependence of the economy on the sectors and resources in the country.
10%
Business Ease
Measures the ease of doing business in the country.
15%
Market Potential Index
The weighted average of the seven factors above to determine the market potential of each economy.
100%
Within each pillar, a set of key indicators have been included with specific weightings to arrive at the overall pillar rank and score. The first two pillars – market size & appeal and macroeconomic resilience – are short-term factors, and account for 40% of the total weighting.
The other five pillars are long-term factors and this account for the remaining 60% of the total weighting.
There are definitely no absolutes in the search for the best market to prioritize in Africa. There will be different answers for different organizations and industries.
You would know best what is necessary to asses opportunity and risk for your organization’s growth plans. Use this tools as a starting point to find the countries that fit properly with your company’s expansion strategy.
We use this tool to perform country comparisons.
Business in Ghana vs. Nigeria
In this article, we do a country-by-country comparison to understand the market potential of doing business in Ghana vs. Nigeria. The market potential across the seven pillars for both countries are:
Nigeria
Ghana
Market Size & Appeal
88
21
Macroeconomic Resilience
29
31
Political Landscape & Governance
58
88
Social & Human Development
52
71
Investment in Technology, Infrastructure & Logistics
36
43
Economic Diversification
6
11
Business Ease
55
72
Africa Market Potential Index (AMPI)
48.53
44.65
The market potential for business in Nigeria slightly edges out Ghana’s market potential.
This is mainly dues to Nigeria’s larger market size.
What it does not have in market size, Ghana makes up for in long-term indicators. Better governance, higher social development, and business ease are segments in which Ghana significantly outperforms Nigeria.
Country Information
Here is some basic information about both countries.
Nigeria
Ghana
Full Name
Federal Republic of Nigeria
Republic of Ghana
Flag
–
–
Currency
Nigerian Naira
Ghana Cedi
Time Zone
(UTC + 1)
(UTC+ 0)
Capital city
Abuja FCT
Accra
Climate
Temperate
Tropical
Area
West Africa
West Africa
Telephone code
(+234)
(+233)
Market Size, Appeal & Resilience
The pillar that gave Nigeria the edge is it’s Market size & appeal. At 8.5 % growth in 2018, Ghana’s economy is among the fastest growing economies in the world.
Regardless, the sheer size of the market is significantly smaller than Nigeria’s economy.
Ghana and Nigeria have similar macroeconomic landscapes. Although Ghana has a lower unemployment rate than Nigeria does, the country has more exposure to external debt that increases its vulnerability to global market dynamics.
Nigeria
Ghana
GDP ppp (nominal)
$1,325.81 Billion
$147.84 Billion
GDP (nominal)
$376.28 Billion
$47.33 Billion
GDP growth
+2.1%
+8.5%
GDP per capita
$2,758
$1,766
Exports
$33.3 Billion
$13.5 Billion
Imports
$35.53 Billion
$13.61 Billion
Balance of current payments
$7.32 Billion
$(-2.83) Billion
External debt (% of GDP)
23.4%
71.8%
Foreign exchange reserves
$ 47.25 Billion
$7.29 Billion
Interest rate
14%
4%
Inflation
11.14 %
9.6 %
Unemployment
18.8%
2.4%
Market Size & Appeal
88
21
Macroeconomic Resilience
29
31
Political Landscape & Governance
Good governance takes factors such as national security, safety, rule of law, political participation, and human rights. The Mo Ibrahim Index of African Governance (IIAG) was used to determine the score and rank for this pillar.
Ghana performs significantly better than Nigeria in terms of good governance.
Nigeria
Ghana
Political Regime
1999 Constitution of Nigeria
Constitutional Republic
President
Muhammadu Buhari
Nana Akufo-Addo
Next Election
2019
2020
Good Governance Score (out of 100)
58
88
Social & Human Development
An economy is only as productive as its people, so the level of social and human development is indicative of progress and future productivity. This pillar looks at the general welfare of the society – access to education, basic amenities, and healthcare.
To get the score, we used a normalized score derived from the IIAG score for Human development and cross-referenced that with the Human Development Index (HDI) by the United Nations Development Programme.
Ghana also outperforms Nigeria in this indicator.
Nigeria
Ghana
Total population
194 Million
28 Million
Growth
+ 2.6 %
+ 2.2%
Population density
210 per sq. km
101.5 per sq. km
Median age
17.9 years
21.1 years
Index of human development (0 – 1)
0.527
0.579
Literacy rate
51.08 %
71.5 %
Life expectancy at birth
53
63
Child mortality rate
104 per 1,000 births
59 per 1,000 births
Urban Population (%)
50.3%
55.3%
Main cities
Lagos, Abuja, Port Harcourt, Kaduna
Accra, Kumasi, Sekondi-Takoradi, Sunyani
Religion
Christianity, Islam, Indigenous
Christianity, Islam, Traditional
Languages
English, >520 languages spoken – Main languages Yoruba, Igbo, Hausa.
English, Twi, Bono, Dagaare, Ewe, Ga, Fante, Talensi, Frafra, Hausa.
Social & Human Development Score (0 – 100)
52
71
Investment in Technology, Infrastructure & Logistics
The measure of growth in any economy is how its constituents allocate its resources more efficiently. Adopting new technology is a way of boosting productivity. The level of investment, development, and adoption of new technology is indicative of the productivity level of an economy.
Also, the infrastructure that enables businesses to produce goods and the ease of moving these goods around through efficient logistics channels is a major determinant of success for businesses in any economy.
A weighted average of the IIAG’s Infrastructure score and World Bank’s Logistics Performace Index gives the score for this pillar.
Although Ghana and Nigeria have a similar economic complexity index (which is an indicator of the complexity of products developed in the country), Ghana gets the slight edge over Nigeria when graded over the entire infrastructural development in each country – particularly in regards to electricity access.
Nigeria
Ghana
Logistics Performance Index (World Rank)
2.53 (110 of 160)
2.57 (106 of 160))
Infrastructure Score (Mo Ibrahim Index)
33.2/100
40.1/100
Economic Complexity Index (ECI)
-1.54
-1.41
Access to electricity (% population)
59.3%
79.3%
Investment in Technology, Infrastructure & Logistics Score
36
43
Resources & Economic Diversification
Economic diversification is generally taken as the process in which a growing range of economic outputs is produced.
Although Ghana’s economy is slightly more diverse than Nigeria’s, both countries are not so different from each other in terms of their lack of economic diversity.
Nigeria
Ghana
Share of industry (% of GDP)
22%
24%
Share of services (% of GDP)
55.8%
52.20%
Share of agriculture (% of GDP)
21%
17%
Main Resources
Oil, Cocoa, Cashews, Ginger
Gold, manganese, bauxite, industrial diamonds, timber, rubber, hydropower, petroleum, silver, salt, limestone
Export Concentration Index (0 – 1)
0.7344281297
0.4277341689
Economic Diversification Score ( 0 – 100)
6
11
Business Ease
The business ease pillar is a measure of how easy it is to partake in business activities in each country. Using a weighted average of the World Bank’s ease of doing business score and IIAG’s business environment score as a determinant of this pillar, Ghana is easier to do business in than Nigeria.
Nigeria
Ghana
Ease of doing business (World rank)
145 out of 194
120 out of 194
Points of Entry
Lagos Port Complex and Tin Can Island Port in Lagos; Calabar Port, Delta Port, Rivers Port in Port Harcourt, and Onne Port.
Tema (GHTEM) and Takoradi (GHTKD)
Rule of Law
–
–
Financial markets
Nigerian Stock Exchange (NSE)
Ghana Stock Exchange (GSE)
Business Ease Score (out of 100)
55
72
Winner
Nigeria
Using the kpakpakpa AMPI tool as a starting point for your analysis, the market potential for business in Nigeria is higher than that in Ghana.
Nigeria does better because of short-term advantages such as its current market size and appeal. Ghana fares better in long-term pillars such as business ease, social development, and most especially in good governance.
Use this framework and customize it to your business priorities to choose between which of the two countries you want to prioritize.