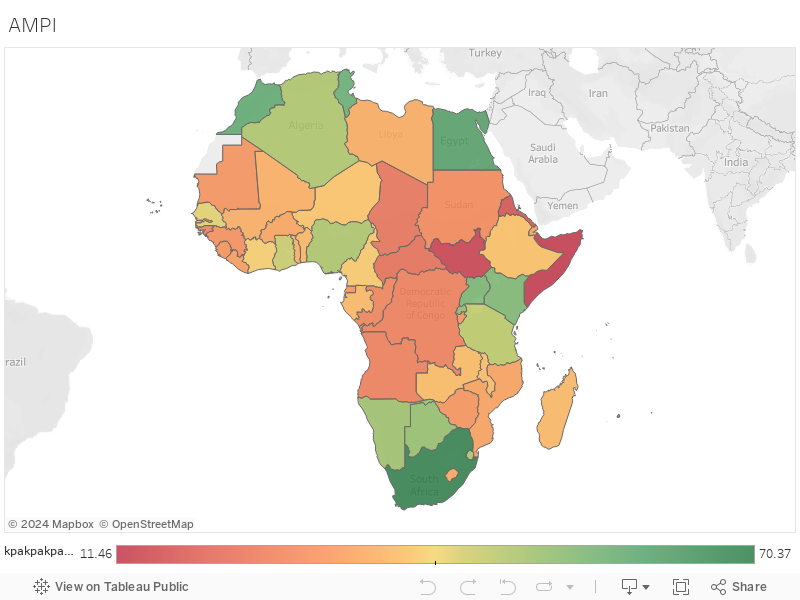
To support business managers in assessing the uncertain environment and adapting organizational strategies to the variable opportunities and risk across the continent, we developed a tool (kpakpakpa Market Potential Index- KMPI) that provides a balanced set of both short and long-term metrics.
To perform a country analysis, we measured key metrics in critical areas of each country’s social-political landscape, economy, technology & infrastructure developments, and the efficiency of doing business in each region.
kpakpakpa’s MPI measures the market attractiveness of 48 African countries, across seven factors that act as key determinants for choosing a location to concentrate your market expansion efforts on the continent.
Description
Weighting
This evaluates the size and appeal of the domestic market.
20%
Measures the stability of the macroeconomic environment.
20%
Measures the quality of governance.
10%
Measures social development of the country.
10%
Measures the efficiency of technology, logistics, and infrastructure as a supporting base for the business environment.
15%
Measures the degree of dependence of the economy on the sectors and resources in the country.
10%
Measures the ease of doing business in the country.
15%
The weighted average of the seven factors above to determine the market potential of each economy.
100%
Within each factor, a set of key indicators have been included with specific weightings to arrive at the overall factor rank and score. The first two factors – market size & appeal and macroeconomic resilience – are short-term factors, and account for 40% of the total weighting. The other five factors are short-term factors and account for 60% of the total weighting.
There are definitely no absolutes in the search for the best market potential. The reality is that there will be different answers for different organizations and industries with varying priorities. These priorities can change over time and the applied weightings will also change too. The kpakpakpa MPI can, however, provide a useful point to begin your analysis and facilitate conversation within your organization on markets to prioritize in Africa.
Business in South Africa vs. Nigeria
In this article, we do a country-by-country comparison to understand the potential of business in South Africa vs. Nigeria – two of the continent’s biggest economies. The market potential across the seven factors for both countries are:
Nigeria
South Africa
88
66
29
55
58
87
52
79
36
75
6
56
55
85
48.53
70.25
Business in South Africa edges out the Nigerian business landscape in all six factors except for market size & appeal.
Country Information
Here is some basic information about both countries.
Nigeria
South Africa
Federal Republic of Nigeria
Republic of South Africa (RSA)
$460 Billion
$400 Billion
Nigerian Naira
South African Rand
(UTC + 1)
(UTC+2)
Abuja FCT
Pretoria (Executive); Bloemfontein (Judicial); Cape Town (Legislative).
Temperate
Temperate
West Africa
Southern Africa
(+234)
(+27)
Market Size, Appeal & Resilience
The factors that gave Nigeria the edge in market size & appeal is the size of its national GDP and projected growth in the next two years. Although Nigeria has a larger-sized economy, South Africa’s economy is more appealing based on the Gross National Income (GNI) per capita – which is a measure of how wealth is spread across the population.
South Africa has a more resilient macroeconomic landscape than Nigeria does. This is mostly caused by Nigeria’s dependence on a few export products, namely crude oil, contributes to its high vulnerability to global economic changes out of its domestic control.
Nigeria also depends on the importation of strategic inputs (foods and refined fuel) a lot more than South Africa does.
Nigeria
South Africa
$1,325.81 Billion
$806.943 Billion
$376.28 Billion
$326.541 Billion
+2.1%
-2.2%
$2,758
$6,207
$33.3 Billion
$88.5 Billion
$35.53 Billion
$87.15 Billion
$7.32 Billion
– $8.08 Billion
23.4%
52.7%
$ 47.25 Billion
$50.51 Billion
14 %
6.5 %
11.14 %
5.5 %
18.8%
27.2%
88
66
29
55
Political Landscape & Governance
Good governance takes factors such as national security, safety, rule of law, political participation, and human rights. The Mo Ibrahim Index of African Governance (IIAG) was used to determine the score and rank for this factor.
Nigeria
South Africa
1999 Constitution of Nigeria
Constitution of the Republic of South Africa, 1996
Muhammadu Buhari
Cyril Ramaphosa
February 2019
2019
58 (35th out of 54)
87 (6th out of 54)
Social & Human Development
An economy is only as productive as its people, so the level of social and human development is indicative of progress and future productivity. This factor looks at the general welfare of the society – access to education, basic amenities, and healthcare.
To get the score, we used a normalized score derived from the IIAG score for Human development and cross-referenced that with the Human Development Index (HDI) by the United Nations Development Programme.
South Africa once again does better than Nigeria in this factor.
Nigeria
South Africa
194 Million
57.73 Million
+ 2.6 %
+ 1.55%
210 per sq. km
45.78 per sq. km
17.9 years
27.1 years
0.527
0.666
51.08 %
94.37 %
53
63
104 per 1,000 births
43 per 1,000 births
50.3%
66.4%
Lagos, Abuja, Port Harcourt, Kaduna
Johannesburg, Capetown, Durban
Christian, Muslim, Indigenous
Christian, Muslim
English, >520 languages spoken – Main languages Yoruba, Igbo, Hausa.
English, Zulu, Xhosa, Afrikaans, English, Northern Sotho, Tswana, Southern Sotho, Tsonga, Swazi, Venda, Southern Ndebele
52
79
Investment in Technology, Infrastructure & Logistics
The measure of growth is how an economy is leveraging new technology to allocate its resources more efficiently. The level of investment, development, and adoption of new technology is indicative of how productive an economy is.
Also, the infrastructure that enables businesses to produce their goods and the ease of moving these goods around through efficient logistics channels is a major determinant of success for businesses in any economy.
A weighted average of the IIAG’s Infrastructure score and World Bank’s Logistics Performace Index gives South Africa a clear advantage over the level of infrastructural development in Nigeria.
Nigeria
South Africa
2.53 (110 of 160)
3.38 (33 of 160))
33.2/100
63.4/100
-1.54
-0.03
59.3%
84.2%
36
75
Resources & Economic Diversification
Economic diversification is generally taken as the process in which a growing range of economic outputs is produced.
South Africa’s economy is more diverse than Nigeria’s economy – with a higher share of its economy focused on industry & services, and the production of a wider range of products. This is compared to Nigeria’s high dependence on crude oil exports to sustain its economy in a global market.
Nigeria
South Africa
22%
26%
55.8%
61.5%
21%
2%
Oil (% of world reserve), Cocoa, Cashews, Ginger
Various Minerals – Gold, Diamonds, Platinum; edible fruit and nuts; beverages; preserved food; tobacco; cereals; wool (not carded or combed).
0.7344281297
0.1209770794
6
56
Business Ease
The business ease factor is a measure of how easy it is to partake in business activities in a certain country. Using a weighted average of the World Bank’s ease of doing business score and IIAG’s business environment score as a determinant of this factor, South Africa has a better environment for business than Nigeria does.
Nigeria
South Africa
145 out of 194
82 out of 194
Lagos Port Complex and Tin Can Island Port in Lagos; Calabar Port, Delta Port, Rivers Port in Port Harcourt, and Onne Port.
Port of Cape Town, Port of Durban, Port of Port Elizabeth, Port of Richards Bay.
$460 Billion
$400 Billion
Nigerian Stock Exchange (NSE)
Johannesburg Stock Exchange Limites (JSE)
55
85
Using the kpakpakpa MPI tool as a starting point for your analysis, South Africa shows more market potential than Nigeria because of its macroeconomic resilience, diversification, human development and ease of doing business. Use this framework and customize it to your business priorities to choose between which of the two countries to prioritize.